SWIS Peak LoadThis might not be the largest peak load that we have this summer, but it's the first of note, so I thought it was worth a look. On Monday 5th January, we recorded a very warm 44 degrees Celsius in Perth, and along with it a high electricity demand. (Although the electricity peak was an hour or so after the temperature peaked.) Below is a chart of approximate electricity demand for the first 6 days of this year. The 5th of January certainly stands out. The chart also shows the mix of generation and their approximate contribution. | AbbreviationsSWIS - South West Interconnected System. Refer to www.imowa.com.au for information on the SWIS. |
South West Interconnected System - Demand (MW)
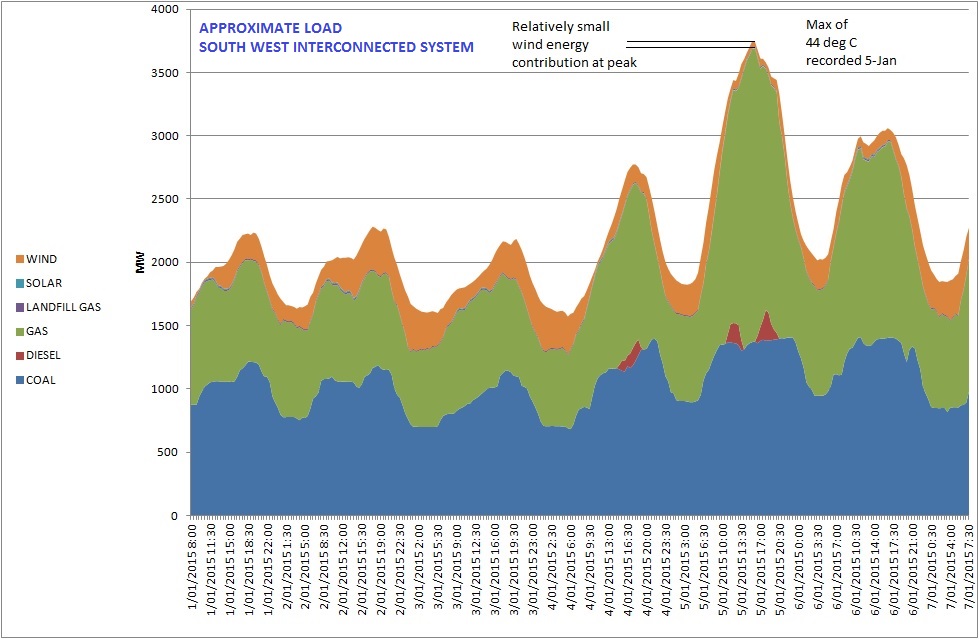
Chart based on raw data sourced from www.imowa.com.au
Dispatch Observations
Natural gas fired generation plant picked up the lion's share of the peak, and we can see that some diesel generation was dispatched as well.
The contribution from wind power plant on the system fell during the height of the peak demand.
The contribution from wind power plant on the system fell during the height of the peak demand.
Disclaimer
The information provided is for general educational or informative purposes only. There is no express or implied guarantee given as to the accuracy or currency of the data. WAPGC accepts no responsibility and disclaims all liability in respect of loss caused due to any errors or inaccuracies. Reliance on the information is at your own risk. The information should not be used for technical or commercial purposes.
The information provided is for general educational or informative purposes only. There is no express or implied guarantee given as to the accuracy or currency of the data. WAPGC accepts no responsibility and disclaims all liability in respect of loss caused due to any errors or inaccuracies. Reliance on the information is at your own risk. The information should not be used for technical or commercial purposes.
 RSS Feed