Why did the Electricity Balancing Price fall in 2014?
Looking at the daily average balancing prices for 2014 shows an interesting change mid year.
The chart below shows the daily average balancing prices for year 2014. These are the blue columns. Each is the simple average of the 48 half hour trading period balancing prices for each day.
Overlaid on the chart are 7 day and 30 day moving averages of the daily average data.
The chart below shows the daily average balancing prices for year 2014. These are the blue columns. Each is the simple average of the 48 half hour trading period balancing prices for each day.
Overlaid on the chart are 7 day and 30 day moving averages of the daily average data.
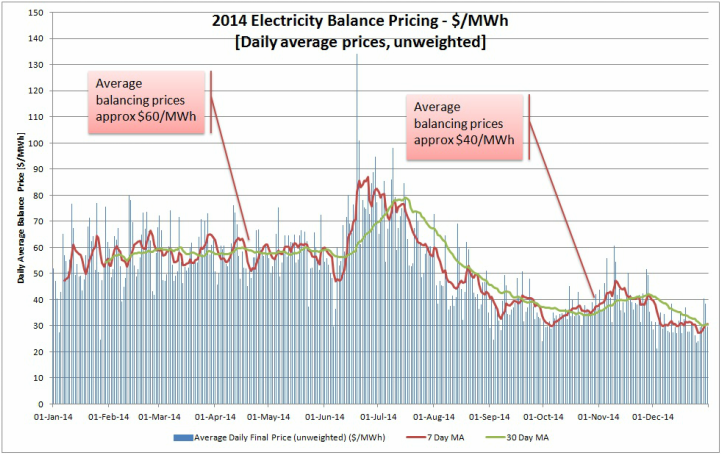
2014 IMOWA Balancing Prices
[Chart based on raw data sourced from IMOWA.COM.AU]
Why the fall in balancing price?
The 30 day moving average shows a distinct change in average balancing price from around $60/MWh in the first half of the year, to about $40/MWh in the second half of the year - a fall of around $20/MWh.
So what happened?
On 1-July- 2014 the carbon tax was repealed.
The carbon intensity of the single largest generating organisation on the SWIS is approximately 0.9 tonne CO2/MWh, and the carbon tax was approximately $23/tonne, which works out to a cost of around $21/MWh.
This matches the fall in balancing prices which occurred around July 2014.
Mystery solved.
Energy Consulting
WA Power & Gas Consulting is a firm of Energy Consultants in Perth WA.
We can assist you with electricity pricing analysis, and your power purchase and gas supply contracts.
We can assist you with electricity pricing analysis, and your power purchase and gas supply contracts.
Disclaimer
The information provided is for general educational or informative purposes only.
There is no express or implied guarantee given as to the accuracy or currency of the data.
WAPGC accepts no responsibility and disclaims all liability in respect of loss caused due to any errors or inaccuracies.
Reliance on the information is at your own risk.
The information should not be used for technical or commercial purposes.
 RSS Feed