+61 8 9317 6340
WA POWER & GAS CONSULTING
  • Home
  • About
  • Services and Projects
    • Services and Projects Summary
    • Energy - Power,Gas,Renewables
    • Project Governance
  • The Team
  • Contact

Process Analyser Problems

10/7/2016

Comments

 
Picture
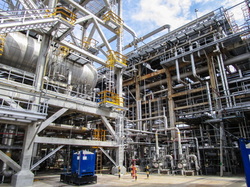
© jaochainoi / Fotolia

When things go wrong

Yet analyser installations can sometimes fail to deliver by:
  • accuracy and repeatability expectations not being met
  • sample response time being too slow
  • delivering poor correlation with laboratory tests.

There are many potential causes of these issues. Obviously the installations must be part of a suitable maintenance program. But regardless of maintenance there are fundamental installation factors that must be considered for each installation. Common issues seen with process analyser installations that cause problems are:
  • incorrect analyser selected for the purpose
  • analyser sample system poorly designed
  • incorrect sample location for the purpose
  • poor selection of analyser location.​

The Process Analyser


​Process analysers (or analyzers) are these days considered essential for modern plant closed loop control, for fiscal metering and to optimize laboratory sampling frequencies.


Process analysers are expensive, with installed costs ranging from $20,000 for simple pH analysers, up to $10,000,000 for complex NMR analyser systems.


After this making such an investment, you want your analyser to function well over its lifetime, reliably producing the intended data stream for operations, billing, and quality control.

Picture
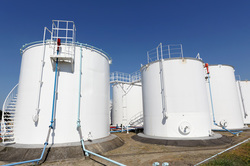
© akiyoko / Fotolia

Process Analyser Troubleshooting

Process analyser troubleshooting can be a difficult task.

​WAPGC have personnel  with successful experience in design, installation and maintenance of process analysers at several Australian/Asian hydrocarbon processing installations. WAPGC personnel have experience with the following process analysers; Gas Chromatograph (GC), Density, IR, Distillation, Viscosity, PH, Flash Point, Cloud Point, Freeze Point, NIR, NMR.


WAPGC can assist you with the identification and rectification of your process analyser issues.

Contact Us
WA Power & Gas Consulting
Energy Consultants
Power Consultants and Gas Consultants
Project Governance Consultants
Perth Western Australia
Comments

Terminology: N+1

22/3/2015

Comments

 
N+1 and N+2 are terms commonly seen when describing a power station planting.
So what do these terms mean?


Disclaimer:

Firstly, it is important to note that the meaning of these terms are often defined in contracts, so they can have different meanings from contract to contract. The meanings of the terms presented here are of a general nature. For the purpose of this discussion, we will ignore the effect of large motor drive starting loads or other special circumstances that might impact selection of generator sizing or the number installed.


Where is it used?

The term “N+1” applies to off-grid or remote power stations such as power stations that supply remote towns or mines which are not connected to the power grid or any other power station. The term doesn’t make a lot of sense in the context of a grid connected power station. This will become apparent in the discussion below.


Picture
How many generators to install? N, N+1, N+2 ?
1. An example of N+1

For the purpose of this description, we will describe N+1 and N+2 in the context of supplying power to a remote mine. For simplicity, we will assume that the power station comprises generators that are all of equal size.

In this instance, the letter “N” represents the number of generator units that are required to run in order to meet the maximum demand of the mine, plus any stipulated spinning reserve.

For example, if the maximum demand at our hypothetical mine was 8 MW, and we were installing generators with a net output of 2MW at site rated conditions, and a minimum spinning reserve of 500 kW was required, then the number of generators, N, required to meet this load would be 5. If the planting requirement was N+1, then the minimum number of generators required to be installed would be 5+1 = 6.
2. What is the purpose of specifying N+1 or N+2?

From the example above you can see that the “+1” or “+2” requires that the power station holds one extra generator for N+1, or two extra generators for N+2, above that required to meet the maximum demand plus minimum spinning reserve.

In the case of N+1, this means that if one generator unit is out of service, either planned or unplanned, then the remaining units should still be able to meet the maximum demand of the load plus minimum spinning reserve. So there is no shortfall of power.

N+1 or N+2 planting specifications are therefore addressing the risk of not being able to meet maximum demand. N+2 mitigates that risk even further than N+1, at the cost of having to install an extra generator.

3. Other Considerations

N+1 or N+2 is a starting point, not the end point, of generator planting considerations.

There are many other factors that can influence the selection of generator type, size and quantity for a given project. The nature of the load has a major influence. The size of step-load changes and the size and nature of motor starts and stops can all have a major influence on the generator selection.


4. Conclusions

We have provided a basic description of the use of N+1 and N+2 terminology in generator planting. It is a starting point when considering the number of generators to be used in a remote off-grid power station application. However there are other technical and commercial factors that will affect the final design and may override any basic N+1 or N+2 basis. Seek the advice of experienced power plant designers when considering the application or interpretation of these terms.

Of course, at WAPGC can help you with your power plant designs and contracts.
Contact Us
WA Power & Gas Consulting.
Energy Consultants.
Power Consultants and Gas Consultants.
Perth Western Australia.

Comments

Operational Readiness

11/2/2015

Comments

 
Picture
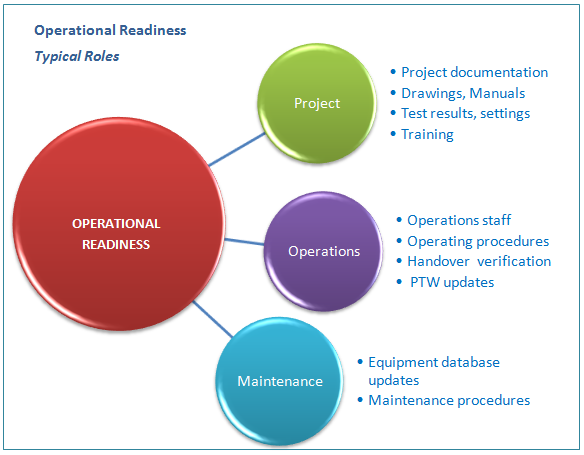
OPERATIONAL READINESS

Operational Readiness is about ensuring that an asset is in a condition that is acceptable for the Operations group to take over, and that the appropriate documentation, training and operational resources are available.

The asset might be a new asset, or it might be an enhanced asset being returned to operation following an upgrade or Turnaround.


Agree The Roles Early...
Roles and responsibilities need to be defined - preferably early in the delivery of a project. The key stakeholders in this process are the project delivery group, operations, and the maintenance group. How the operational readiness roles are attributed will depend on the agreed processes and division of responsibilities within an organisation. 
Picture

Consider Compliance Obligations at Handover...

The Operations group often has the role of checking and verifying the data supplied by the Project group. 
Picture
Operations, as the owner of the plant once handed over, can also have the role of registering classified plant and carrying out other activities required by Regulations.

Picture
Have an Operational Readiness Plan...
The key to effective Operational Readiness is to have a plan. The Operational Readiness Plan should be tailored to suit the complexity of the project. It is preferable that the Operational Readiness Plan is developed early in the project. This will help:

  1. Define the requirements for Operational Readiness.
  2. Obtain agreement on roles and responsibilities for operational readiness deliverables.
  3. To allow time to plan and prepare training and procurement activities required to achieve Operational Readiness.


WA Power & Gas Consulting provides Operational Readiness services for smooth transitions from projects to operations.
Contact Shean Bond to discuss your Operational Readiness Requirements.
Contact WAPGC
Comments

Electricity Balancing Prices 2014 - what caused the drop?

17/1/2015

Comments


Why did the Electricity Balancing Price fall in 2014?

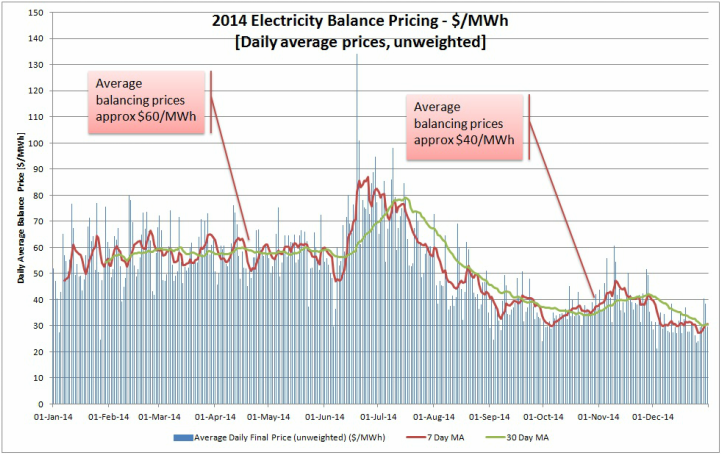
Looking at the daily average balancing prices for 2014 shows an interesting change mid year.

The chart below shows the daily average balancing prices for year 2014. These are the blue columns. Each is the simple average of the 48 half hour trading period balancing prices for each day.

Overlaid on the chart are 7 day and 30 day moving averages of the daily average data.
2014 Balancing Prices
2014 IMOWA Balancing Prices
[Chart based on raw data sourced from IMOWA.COM.AU]

Why the fall in balancing price?

The 30 day moving average shows a distinct change in average balancing price from around $60/MWh in the first half of the year, to about $40/MWh in the second half of the year - a fall of around $20/MWh.

So what happened?

On 1-July- 2014 the carbon tax was repealed.

The carbon intensity of the single largest generating organisation on the SWIS is approximately 0.9 tonne CO2/MWh, and the carbon tax was approximately $23/tonne, which works out to a cost of around $21/MWh.

This matches the fall in balancing prices which occurred around July 2014.

Mystery solved.

Energy Consulting

WA Power & Gas Consulting is a firm of Energy Consultants in Perth WA.
We can assist you with electricity pricing analysis, and your power purchase and gas supply contracts.

Disclaimer
The information provided is for general educational or informative purposes only.
There is no express or implied guarantee given as to the accuracy or currency of the data.
WAPGC accepts no responsibility and disclaims all liability in respect of loss caused due to any errors or inaccuracies.
Reliance on the information is at your own risk.
The information should not be used for technical or commercial purposes.

Comments

SWIS Summer Peak Load January 2015

8/1/2015

Comments


SWIS Peak Load

This might not be the largest peak load that we have this summer, but it's the first of note, so I thought it was worth a look.

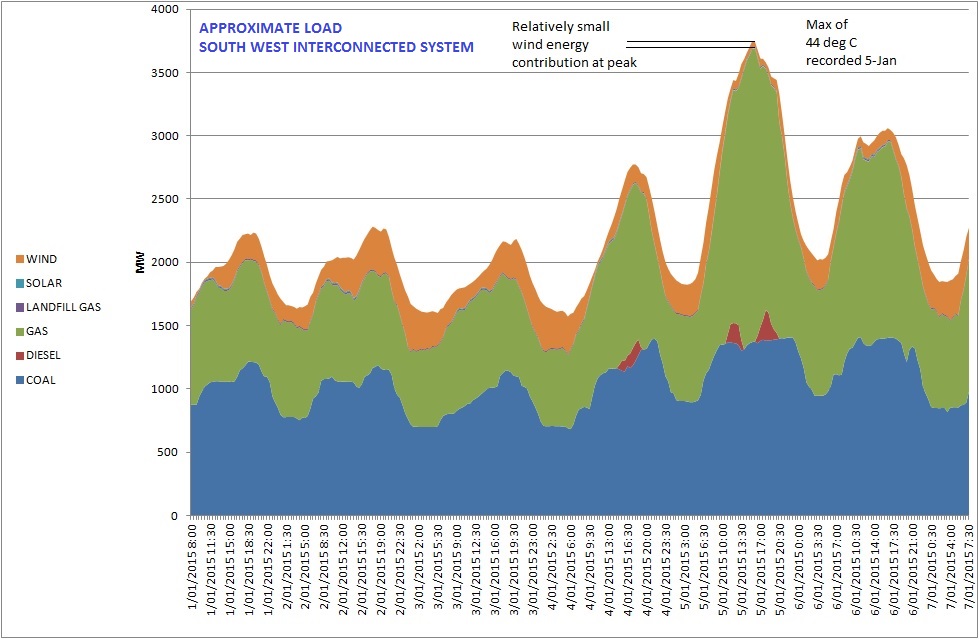
On Monday 5th January, we recorded a very warm 44 degrees Celsius in Perth, and along with it a high electricity demand. (Although the electricity peak was an hour or so after the temperature peaked.)

Below is a chart of approximate electricity demand for the first 6 days of this year. The 5th of January certainly stands out.

The chart also shows the  mix of generation and their approximate contribution.

Abbreviations

SWIS - South West Interconnected System.

Refer to www.imowa.com.au for information on the SWIS.

South West Interconnected System - Demand (MW)

Picture
Chart based on raw data sourced from www.imowa.com.au

Dispatch Observations

Natural gas fired generation plant picked up the lion's share of the peak, and we can see that some diesel generation was dispatched as well.
The contribution from wind power plant on the system fell during the height of the peak demand.

Disclaimer 
The information provided is for general educational or informative purposes only. There is no express or implied guarantee given as to the accuracy or currency of the data. WAPGC accepts no responsibility and disclaims all liability in respect of loss caused due to any errors or inaccuracies. Reliance on the information is at your own risk. The information should not be used for technical or commercial purposes.

Comments

    Info-Blog

    Author

    WAPGC

    Archives

    July 2016
    March 2015
    February 2015
    January 2015

    Topics

    All
    Analysers
    Analyzers
    Electricity Price
    Operational Readiness
    Operations
    SWIS

    RSS Feed

Picture
WA POWER & GAS CONSULTING 
+61-8-9317 6340
Perth, Western Australia